Winning at DP VISION — suspiciously easily…
The folks at Oblivious recently released a few games that try and convey some of the intuition around uncertainty in differential privacy. In all of them, the player has to choose a privacy budget and get some randomized information about a secret. The goal is to guess the secret using the smallest possible total privacy budget. Neat idea!
The games are about DP and they have a public leaderboard, so this might as well be my own personal catnip: of course I had to go and get the high score. Let's take a look at the first one: DP VISION.
The game
Each game has five rounds. In each round, you are presented with three pictures that kind of look like each other (let's call them A, B, and C). One of them is the "right" one, and your goal is to find out which one it is. To do that, you have access to a "noisy" image, composed of tiles selected from one of the three pictures using a DP mechanism. With a \(\varepsilon\) value of \(0\), the tiles are selected completely randomly; with a very high \(\varepsilon\), the tiles all come from the right picture. If that was unclear, go play a few games, you'll get the idea.
The pictures are 180×160 pixels, split into 18×16 = 288 tiles. Each tile is selected using an exponential mechanism with budget \(\varepsilon/288\), where you (the player) selects the \(\varepsilon\). Assuming they implemented it in the optimal way, this is equivalent to randomized response with 3 options: it chooses the correct picture with probability \(p_{correct}=\frac{e^{\varepsilon/288}}{(e^{\varepsilon/288}+2)}\), and each of the other two with probability \(p_{wrong}=\frac{1}{(e^{\varepsilon/288}+2)}\).
Now, how to win this?
The strategy
The information you get in the tiled image boils down to: how many tiles come from each picture? Each choice of tile is biased towards the right picture, so the best possible strategy is simple: just pick the picture where most tiles come from. What's the probability that this choice is the right one?
If the correct one is A, the three tiles counts \((n_A,n_B,n_C)\) are distributed as a multinomial distribution with \(n=288\) trials and event probabilities \((p_{correct},p_{wrong},p_{wrong})\). If we resolve ties randomly, we will win with probability:
Can we simplify this formula into something easy to compute? I tried (not very hard) and failed, and instead wrote some Python code to compute it numerically.
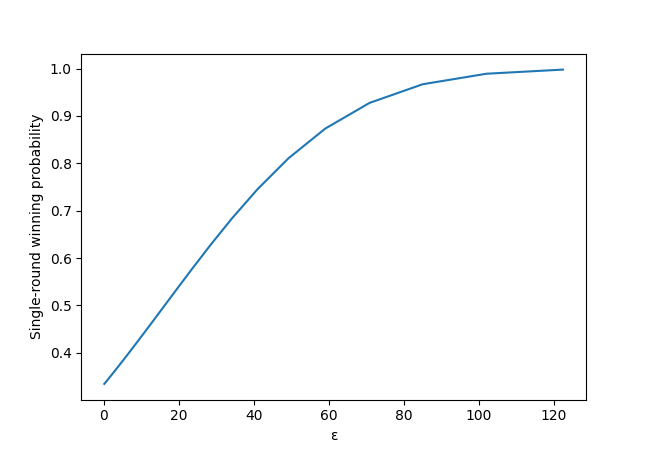
This gives us this nice graph. It seems like we need quite a large \(\varepsilon\) to get good winning chances!

Now, what \(\varepsilon\) should I pick? Well, it depends how many times we're willing to try to play before winning. Say I would like at least a 50% chance of winning after 10 games: if \(p_{wingame}\) is the probability of winning a game, we want \(\left(1-p_{wingame}\right)^{10}=50\%\), which gives \(p_{wingame}=1-\exp\left(\ln(0.5)/10\right)≈7\%\).
But to win each game, we have to get the right solution 5 times in a row. So if \(p_{winround}\) is the probability of winning a round, we have \(p_{wingame}=p_{winround}^5\). With \(p_{win}^5=7\%\), this gives \(p_{winround}≈59\%\). Looking at our graph above, this means we need \(\varepsilon\approx25\).
The execution
We don't want to painfully count the tiles by hand. So instead, we'll copy/paste some JavaScript code into the browser console to download the images, and use a little Python script to split the pictures and count the tiles.
Then, to increase our chances of victory and lower our total \(\varepsilon\) budget, we'll cheat a little: we'll choose the first guess at random with \(\varepsilon=0\), and reset the game if we guess wrong. The same strategy could be applied for multiple guesses, of course: we could be lucky 5 times in a row, and get the best-possible score of \(\varepsilon=0\). But this would only happen with probability \(0.5\%\), so this would take annoyingly many guesses.
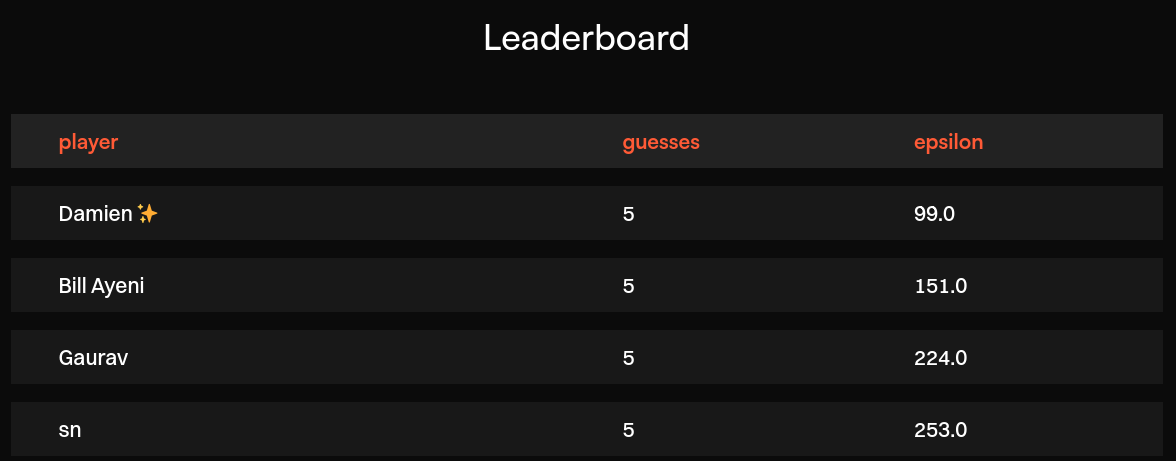
Instead, let's pick just the first one randomly, use \(\varepsilon=24\) for the second and \(\varepsilon=25\) for the last three to aim for a two-digit number, and… tadaaa! ✨

First try! We got lucky!
… or did we?
The investigation
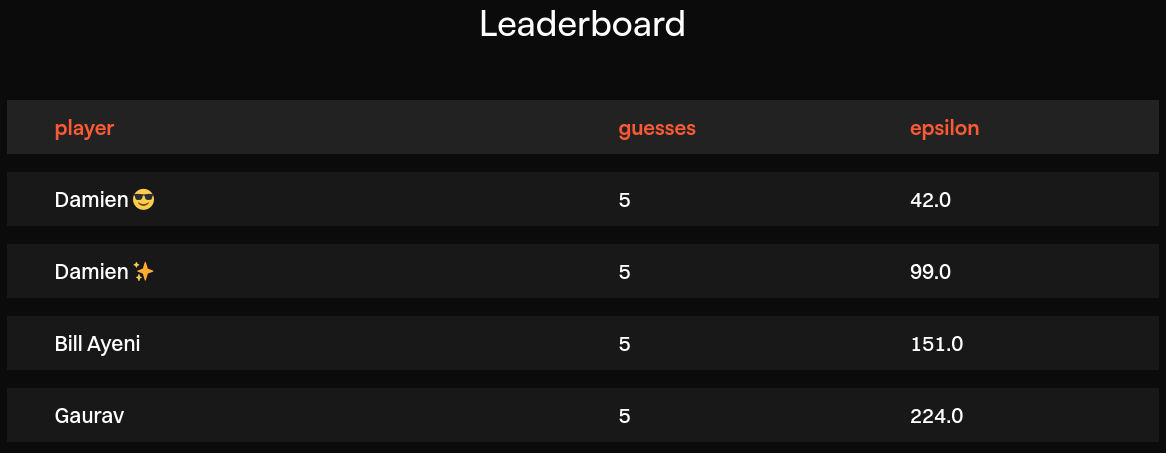
Well, let's try again, this time with a smaller \(\varepsilon\) value, and see what happens. Let's go for about half, to get a nice round number.

That took three tries. At that point, I start getting suspicious. With such low \(\varepsilon\) values, the chance of winning a game should be below 4%. This should have taken a lot more than 3 tries.
So I decide to do a little experiment. Playing a round with \(\varepsilon=16\) should give me about even odds of winning. So I try it 20 times and… win 19 of the rounds. That can't be right. Winning 95% of the time should only happen with \(\varepsilon\) values between 60 and 80, or maybe 50 if we're lucky.
At that point, obviously, I figure I must have messed something up. What are possible explanations for this?
- My math is wrong. I double-check it and can't find any issue.
- My code is wrong. I triple-check it, rewrite it in a simpler way, but can't find any issue.
- My assumptions about the mechanism are wrong. But if the privacy budget is split in 288 for each round, and each tile is chosen independently of the others, then randomized response is the best possible mechanism. A different mechanism would have a worse privacy-utility trade-off, leading to a worse success rate than expected. But we're seeing the opposite here, so that can't be it.
- The implementation of the game is wrong? The only way to be sure is to ask, so I email the folks at Oblivious to try and figure out what's going on.
And… vindication \o/ They (very quickly) confirm that there was, in fact, a misunderstanding that led to an actual privacy budget consumption that was off by a factor of four. This matches our rough estimate from our little experiment above! Jack Fitzsimons, CTO at Oblivious, says:
The games were a fun idea to try to share intuition into differential privacy with non-technical stakeholders at this year's Eyes-Off Data Summit. When Microsoft's Data for Good team spoke about the broadband release using 0.1 epsilon, we wanted folks even from a legal perspective to have an intuition that that is very low.
Of course these games were made quickly and in ad-hoc JavaScript (in fact the answers are technically always in plain sight in your browser console), there was a miscommunication to the web developers about switching from the Add-One-Replace-One model to the Replace-One only model, leading to a rogue 4 in the exponent. It has since been patched and the scores corrected accordingly.
I think it's extremely cool that Damien spotted this with a privacy audit. Firstly, as it's only a game to build understanding, we likely would not have spotted the bug as we moved on with more pressing work. But it also shows the power of community in building privacy systems. Cryptography as a whole benefits enormously from open source and peer review, and here in a small microcosm of differential privacy around some community games we see the same occurring.
Hat's off to Damien!
The discussion
Games are a great teaching tool. Getting people to understand DP math is hard. Our community hasn't historically been doing a great job at it. Even basic concepts (e.g. larger \(\varepsilon\) values translating to better utility and worse privacy) can feel very abstract. It's hard to convey noise and uncertainty in an intuitive way. So I find it really exciting when people come up with new ways of approaching the problem, like these games. By making it visual and fun, they help people get a more "visceral" feeling of how increasing the \(\varepsilon\) lets them learn more information. And the public leaderboard is, of course, nerd-sniping people like me into spending a weekend coding a strategy to beat the high score. So I'm grateful that folks are experimenting with this idea!
We need more ideas to convey intuition around privacy budgets. To get a good intuition around the magnitude of the \(\varepsilon\), we would probably need different game mechanics. DP VISION (and other games) use randomized response, a local DP mechanism where noise is added to each data point. This leads to brutal privacy-utility trade-offs, with very high \(\varepsilon\) values compared to mechanisms used in the central model. And the mechanism used in the game is extremely "inefficient": to choose between 3 options, we would want to run randomized response once, not 288 times. Of course, this would make the game a lot less fun and visual! Coming up with a game where people play with common central DP mechanisms, like Laplace or Gaussian noise, would be great.
Correctly implementing DP is tricky. Even for simple mechanisms like this one, privacy mistakes are easy to introduce and hard to notice. Trying the game a few times with very low or very high \(\varepsilon\) values will produce a behavior that "looks right": you actually have to do some math and statistical testing to figure out that something is wrong. For a longer tangent about building robust DP software, here's a thing I wrote about this topic recently.
Privacy auditing is not just important, it's fun too. The little experiment we did where we interacted with a DP mechanism, observed its behavior, and deduced a rough lower bound on its privacy budget? This is a "real world" example of privacy auditing, a branch of DP research that tries to find bugs in DP implementations empirically, with the same idea (though usually with more serious math). There are a lot of papers about it, and just like in this post, many of them end up actually finding vulnerabilities! This was the first time I actually did anything like this, and it was super fun — similar to how other people have described the joy of reverse-engineering software.
The epilogue
The privacy bug in the game was (obviously) not in scope for their official bug bounty program. But Jack mentioned a possible reward after I pointed out the discrepancy, and took my suggestion to send it to a local charity instead: that's 200€ going towards the great folks at TENI. Nice!
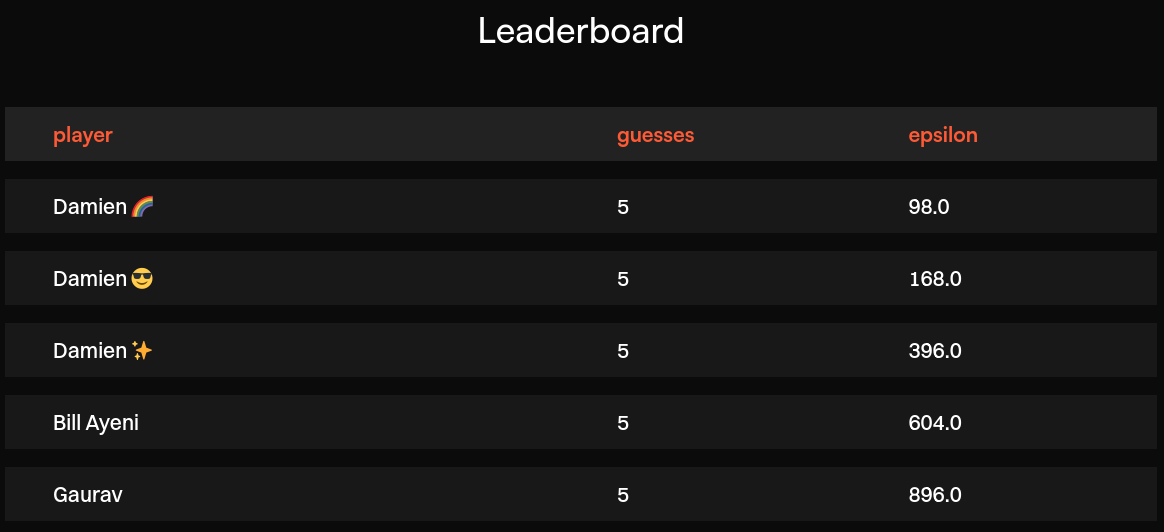
The folks at Oblivious also fixed the bug, and multiplied everyone's score by 4 on the leaderboard to reflect the actual privacy budget consumption of past runs. An excellent opportunity to both check that my original strategy was sound, and reclaim a two-digit score.

And I could only achieve this score after a few unsuccessful attempts, as expected!
Thanks to Jack Fitzsimons for answering my questions in a very timely way, and providing feedback on drafts of this post. Also thanks to Jordan Rose for lightning-fast typo-finding.

